Traffic Source Detail Dashboard
Within Odyssey, every traffic source can be analyzed into detail. Data gathered about any traffic source is available in the traffic source dashboard. Providing you with an overview of actionable insights.
Distribution
The distribution of a traffic source along the entire customer journey is represented by a graph. The distribution shows the position of the traffic source. This graph is divided into ten “buckets”, represented by the vertical blocks. Here, the left is the beginning and the right is the end.
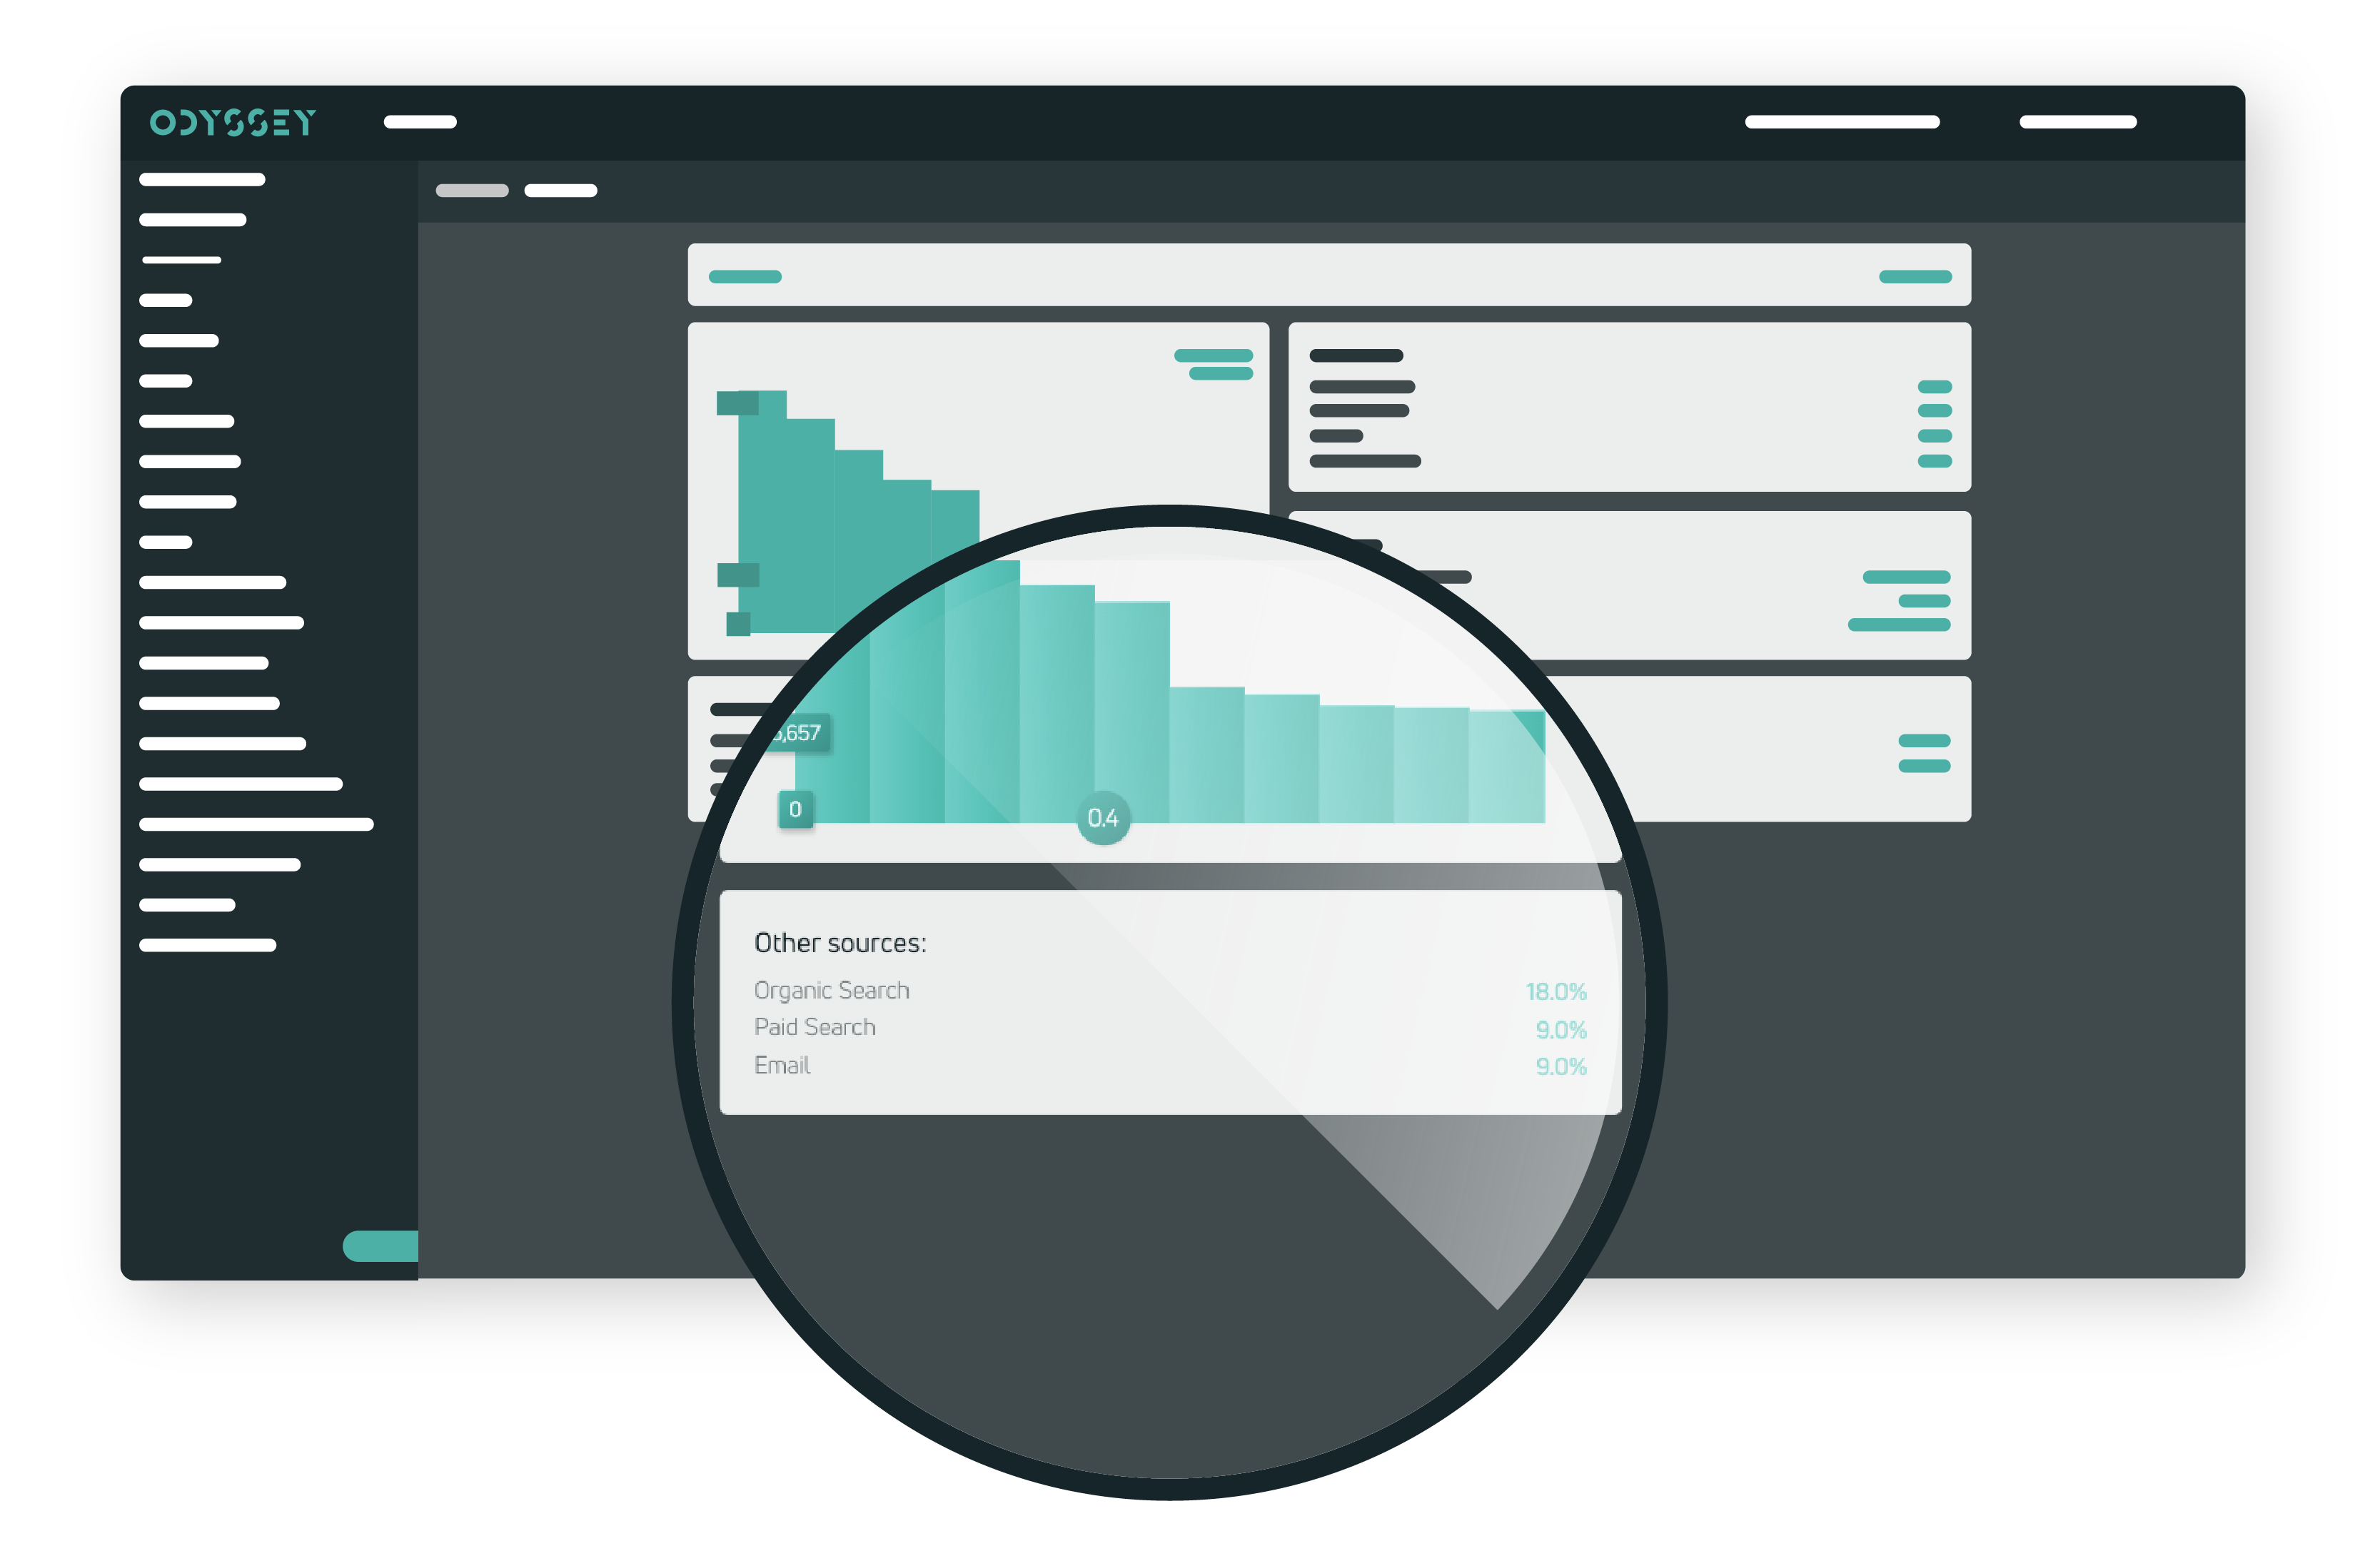
Other sources
Obviously, most customer journeys consist of multiple traffic sources. The presence of other traffic sources within the customer journey is represented in this dashboard. Providing you with insights into the relationship between different traffic sources.
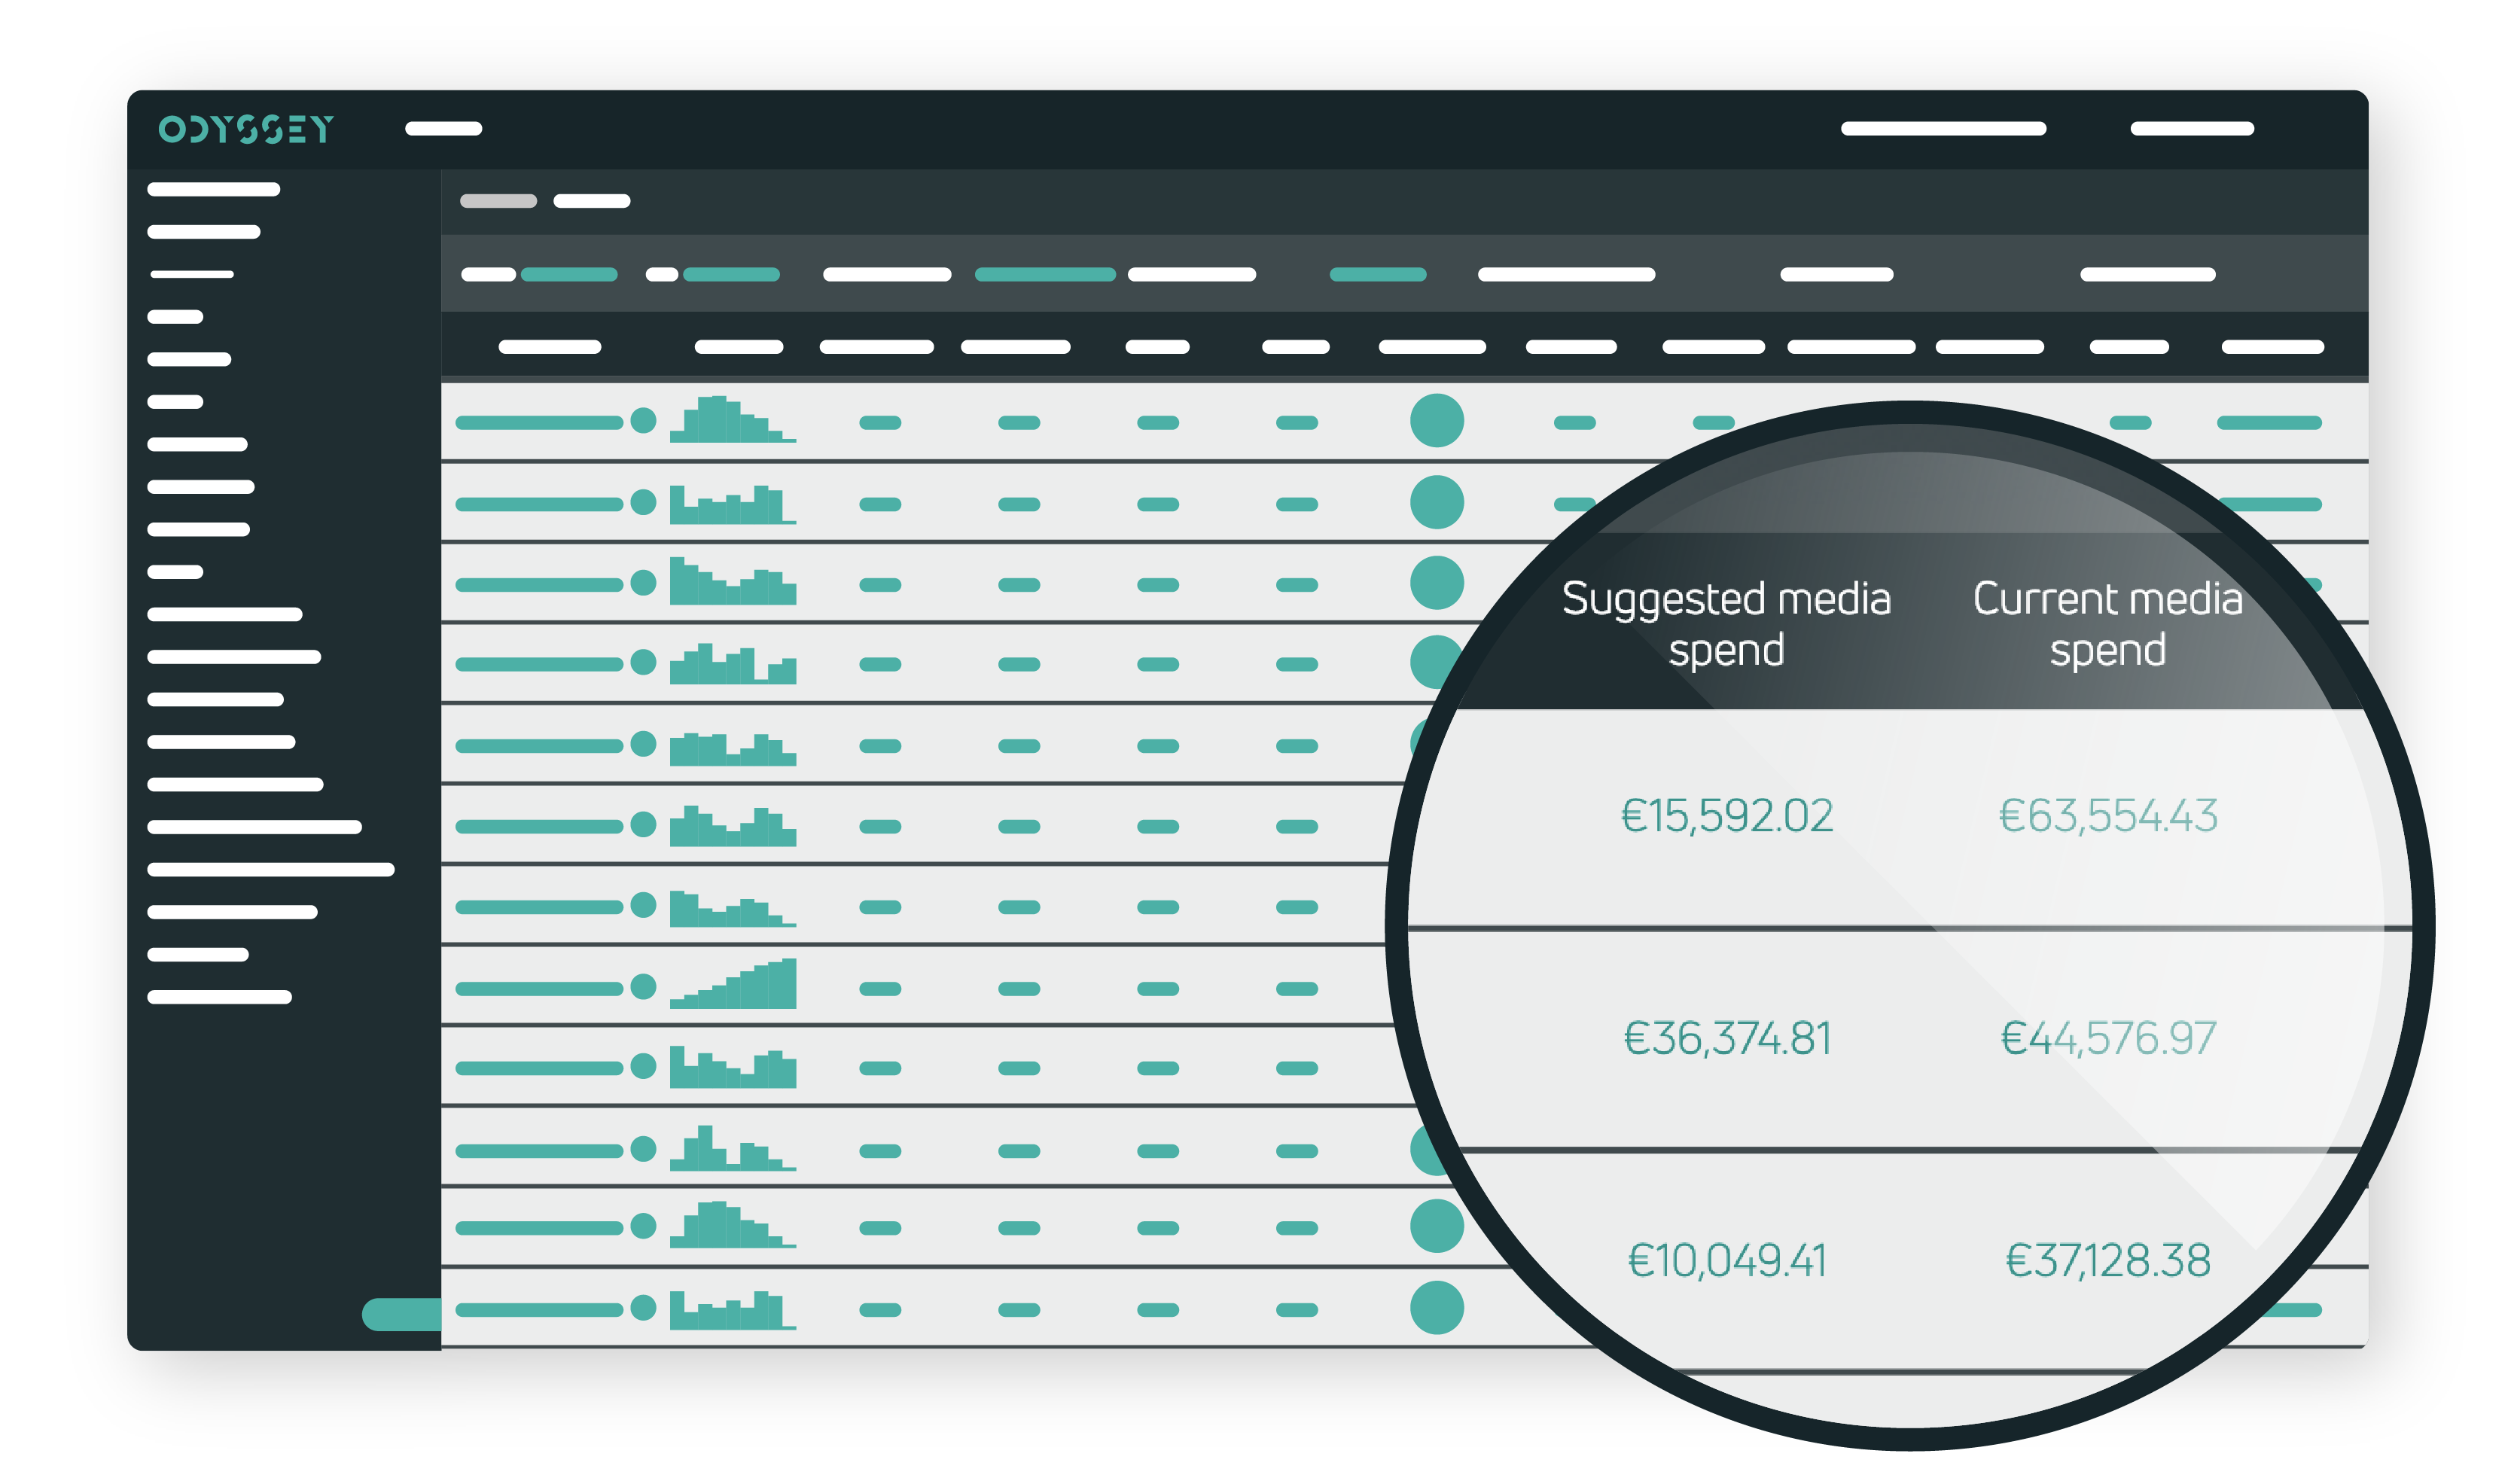
Revenue
The revenue tab shows you insights regarding the revenue this traffic source has participated in. This tab provided you with information regarding the current media spend and the suggested media spend.
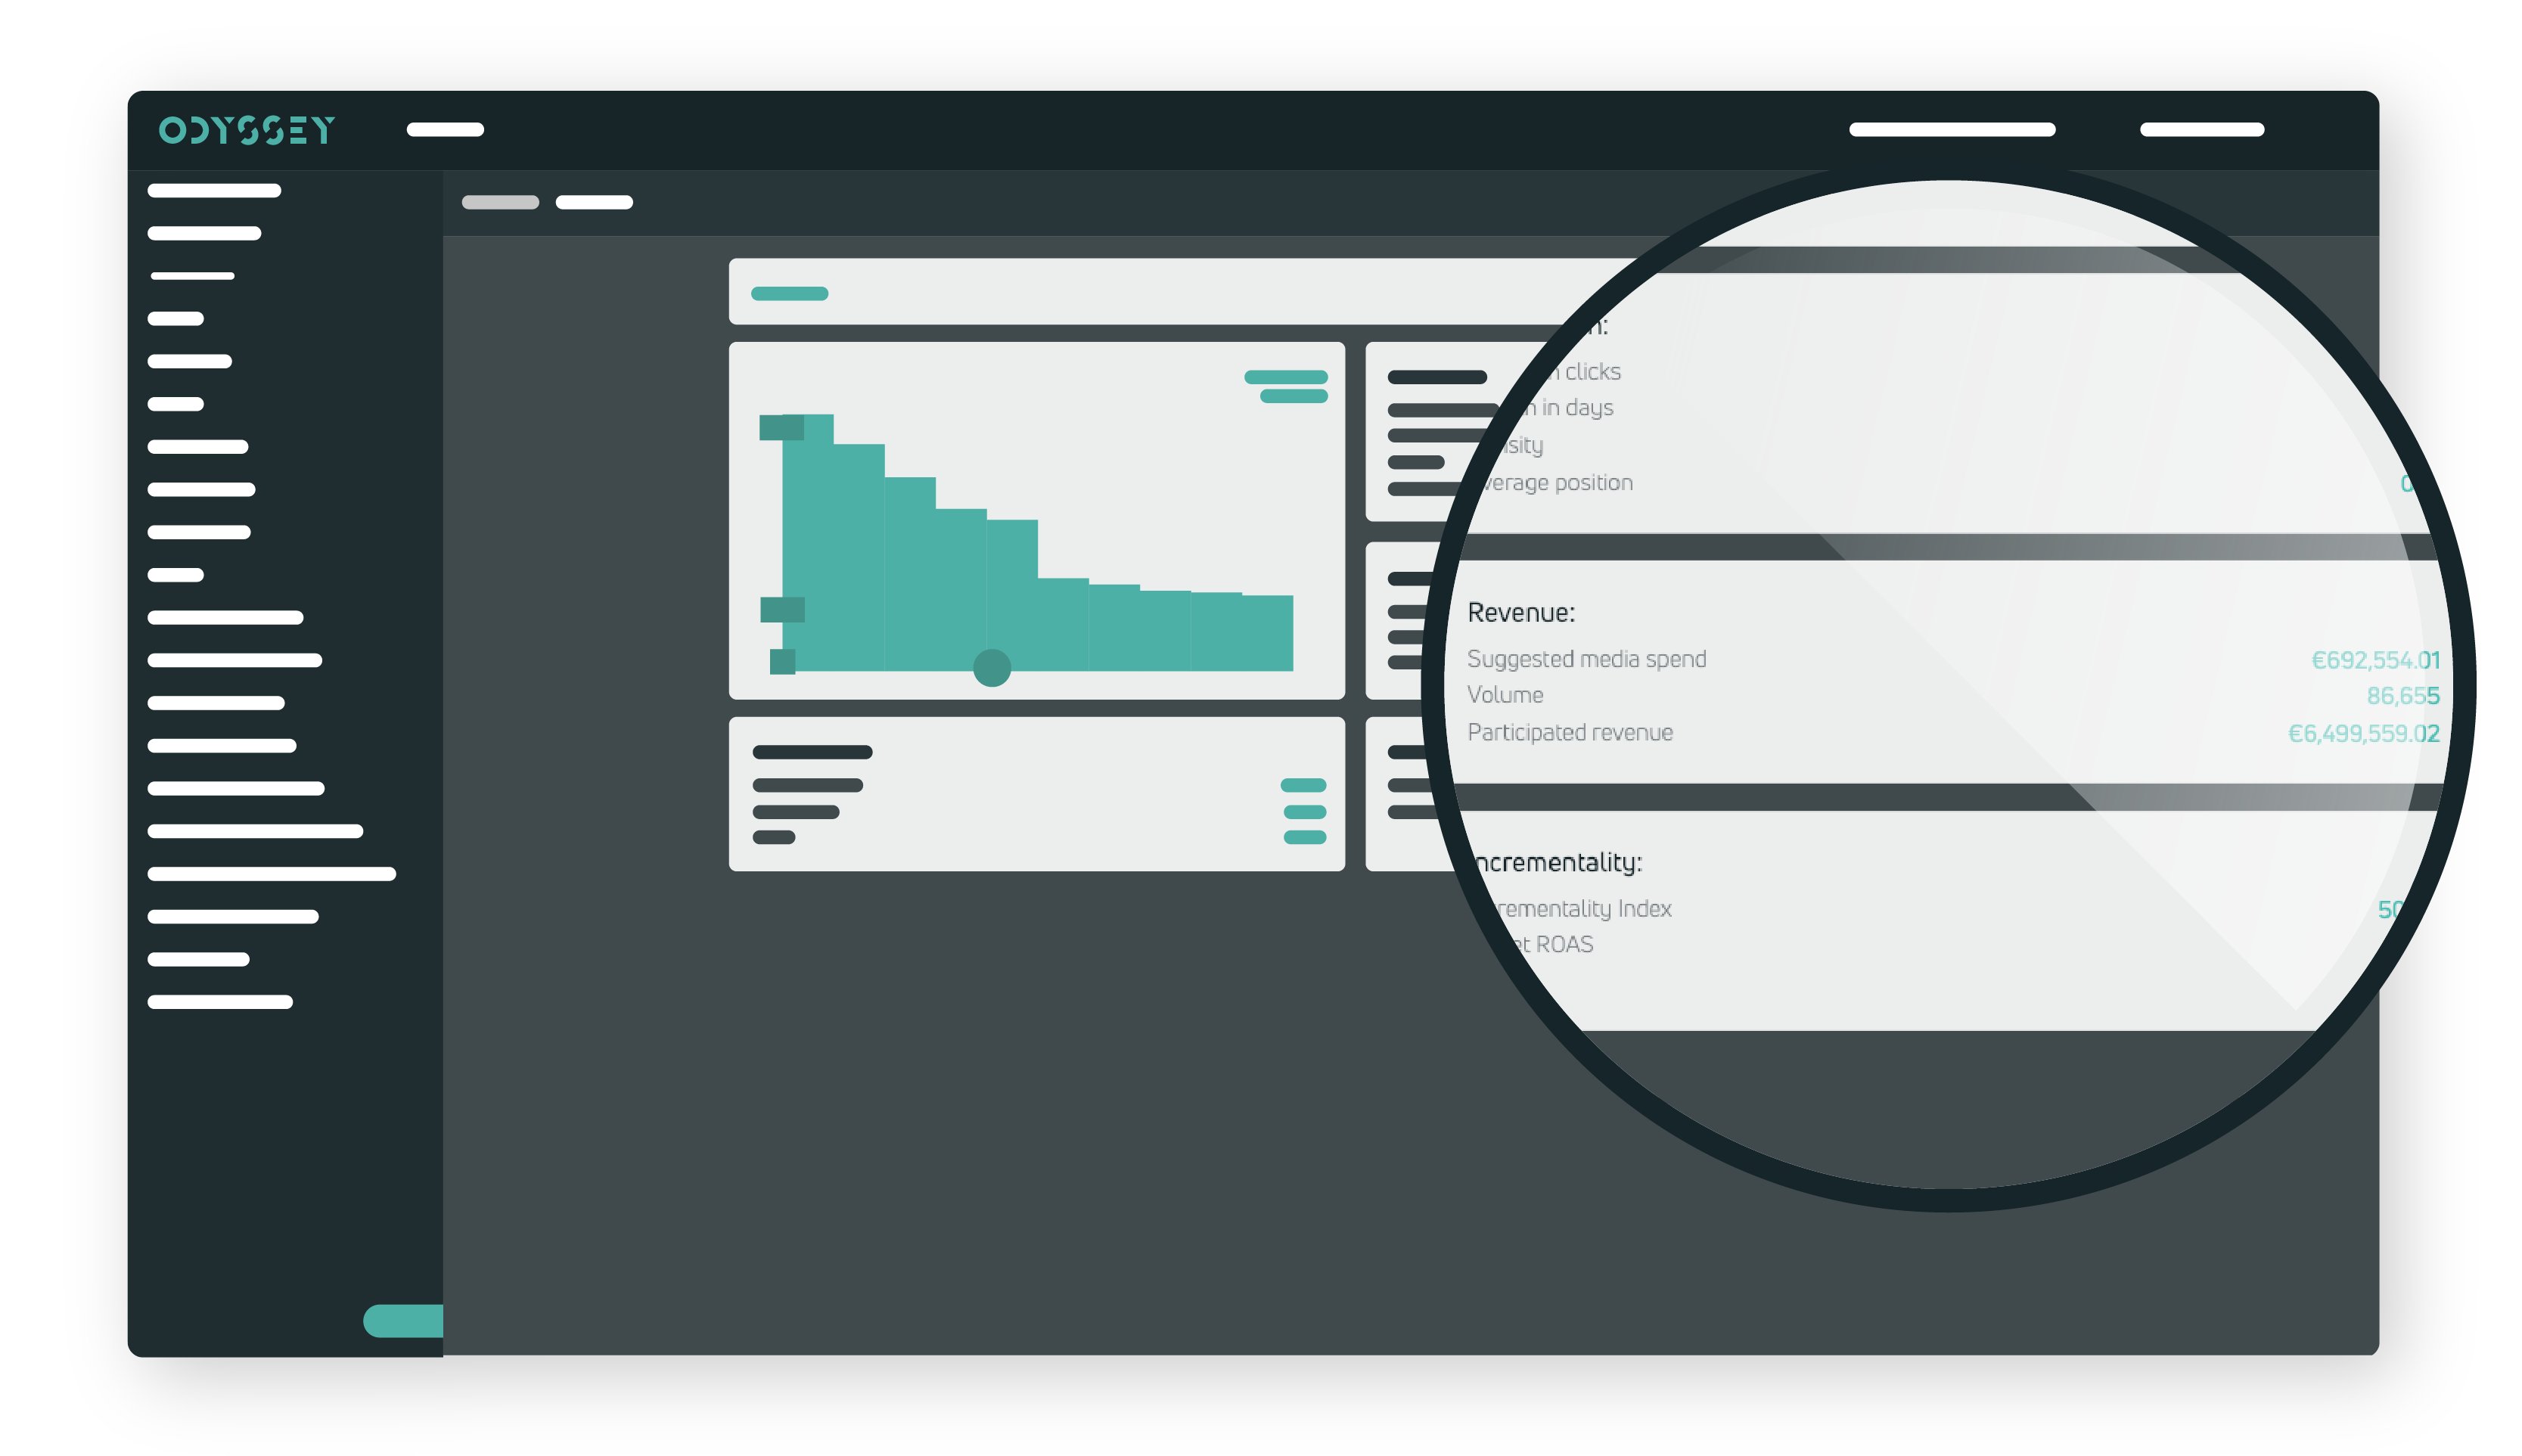
Incrementality
This is what it is all about. Showing you the incrementality in percentages and the target ROAS of this traffic source. Learn more